Energy Transition Isn’t Linear—But It Is Profitable (If You See It Coming)
By Entelligent Research Team
Part 1: Markets Are Pricing a Tariffs-Induced Shift
Amid recent market volatility, investors are asking whether tariffs could slow down the progress of the energy transition. At first glance, tariffs introduced by a new U.S. administration might indeed seem likely to hinder the transition, particularly if one assumes that policy measures are the primary driver of low-carbon investments.
However, focusing only on policy gives an incomplete picture. Other secular forces continue to propel the energy transition. Technological advancements are steadily making renewable and alternative energy sources more cost-competitive, whereas traditional fossil fuels become harder and more expensive to extract. Meanwhile, increasing awareness among consumers and producers is shifting market preferences in favor of cleaner energy solutions.
Tariffs could slow down the energy transition, especially if policy action is assumed to be the main driver.
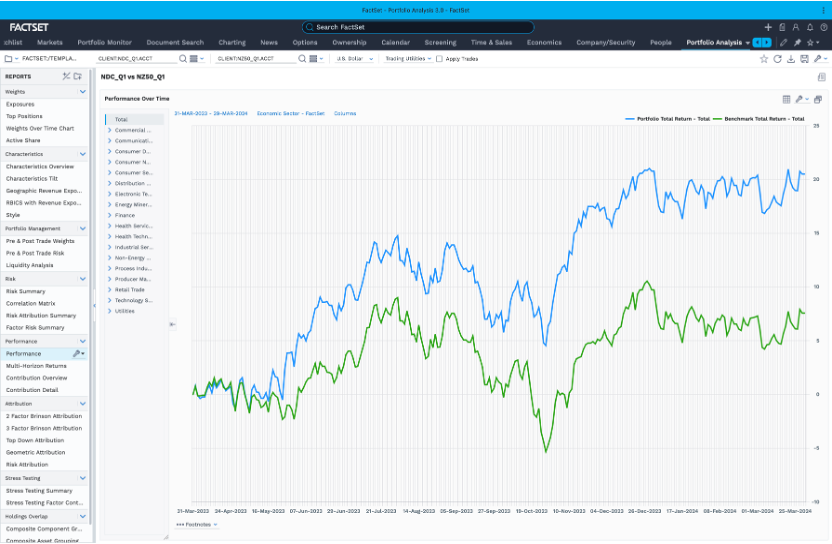
Looking at two economic scenarios, such as NZ50 (Net Zero 2050), a highly globally coordinated transition, or NDC (Nationally Determined Contributions), a less ambitious transition, recent market data provide evidence of these dynamics. Beginning in early 2024*, as investors started anticipating a potential U.S. administration change, an S&P 500-based** portfolio comprising NDC “Transition Leaders”*** significantly outperformed a comparable portfolio composed of NZ50 “Transition Leaders”. The NDC-aligned portfolio beat the NZ50-aligned portfolio by over 13% in the year up to April 1, 2024, and by nearly 7% in the year up to April 1, 2025. This suggests that the market has been assigning a higher probability to the NDC economic scenario.

Over the past two years, markets appear to have been pricing in an NDC economic scenario (a less ambitious, less globally coordinated transition) rather than a NZ50 trajectory. Recent evidence suggests that tariffs have further reinforced this shift: year-to-date, an NDC-aligned portfolio has outperformed an NZ50-aligned portfolio by over 4%. This outcome underscores that investors still expect an energy transition to unfold, but with more modest policy ambition and international coordination.
Part 2: Why Smart Investors Are Pivoting with the Energy Transition
The question now is whether the new U.S. administration’s shift toward “America First” policies has started to put the energy transition into reverse.
Looking back to one year ago (early 2024), an NDC “Transition Leaders”*** portfolio was underperforming its S&P 500** benchmark by about 10%. Notably, most of that underperformance came as investors increasingly priced in an U.S. administration change, as reflected in market behavior at the time. At first glance, this would suggest that the prospect of a less globalist administration was hurting companies aligned with the energy transition.
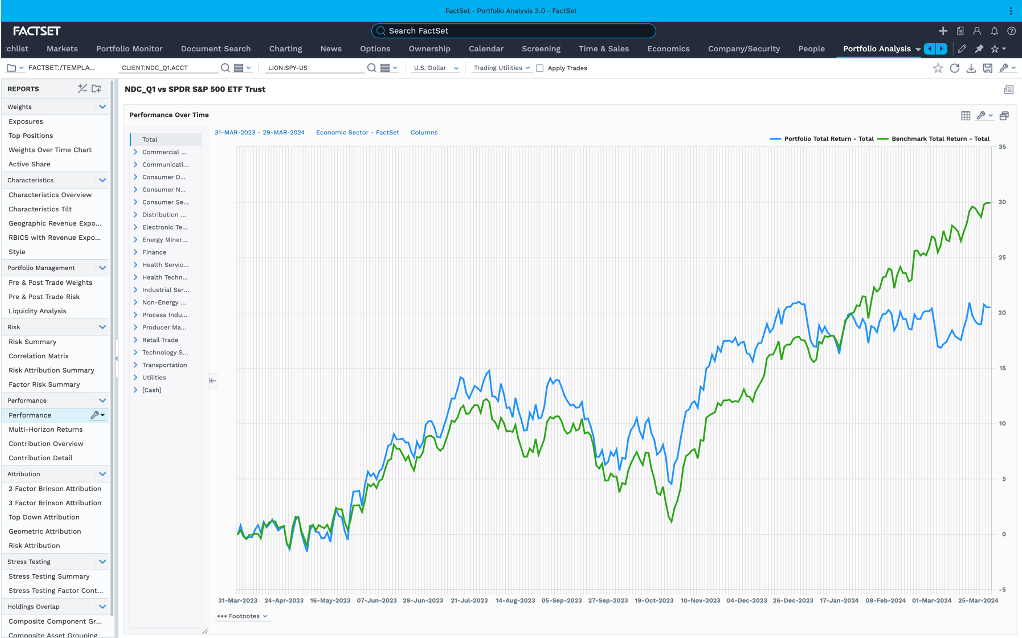
Since then, that trend has reversed. By mid-2024, the NDC-aligned portfolio had begun to outperform, and over the last twelve months it has outpaced the S&P 500 by more than 11%. In fact, as of early 2025, it continues to maintain a modest lead—approximately +2% year-to-date—over the broader market.
Has the new U.S. administration’s shift toward “America First” policies put the energy transition into reverse?

The market clearly still anticipates an energy transition, just not a rapid or globally coordinated one. This expectation has proven resilient even in the face of tariff headwinds: so far in 2025, the NDC-aligned stocks have edged out the overall market by roughly 2%. In short, investors appear to be betting on a continued transition, but in a more incremental, nation-by-nation fashion rather than an aggressive worldwide push.
Part 3: How to Read the Market’s Energy Transition Playbook—In Real Time
While the above analysis clarifies recent trends, it would be highly advantageous for investors to identify ahead of time which climate transition pathway the market expects. Being able to anticipate the market’s favored scenario would greatly aid risk managers and performance analysts in positioning portfolios optimally.
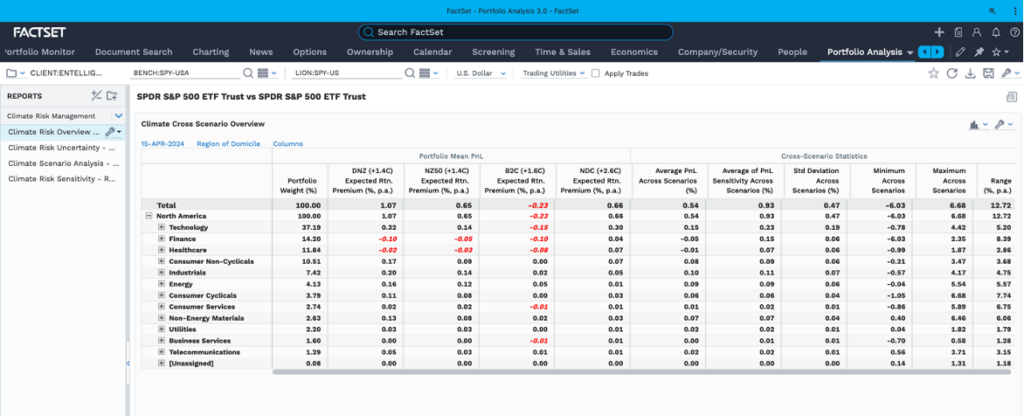
By using multi-scenario transition risk analysis (for example, Entelligent’s T-Risk tool on the FactSet platform), investors can quantify how different transition scenarios might impact portfolio returns. This risk management approach provides insight at multiple levels — from the overall portfolio down to specific sectors and regions. In practice, these tools can highlight which economic scenario the market is currently pricing in, enabling proactive portfolio adjustments.
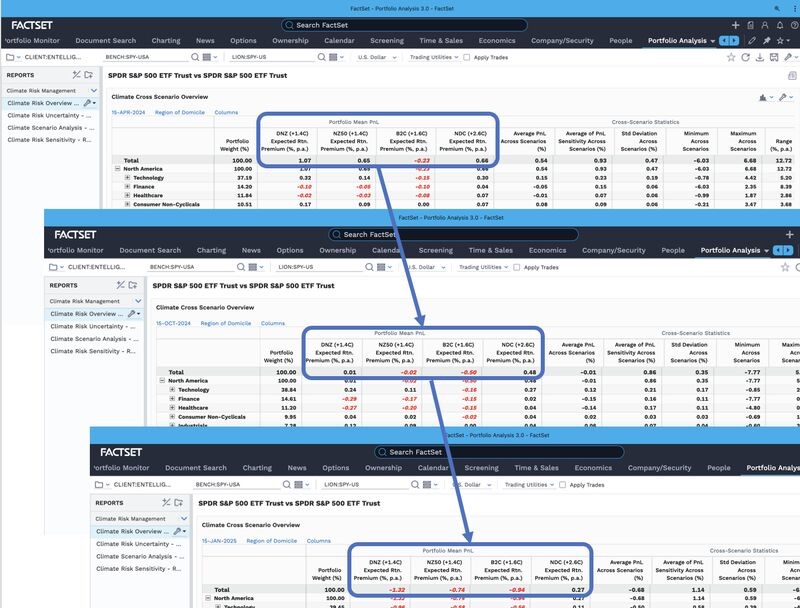
Consider the S&P 500** as a sample portfolio. In April 2024 (one year ago), nearly all the economic scenarios available in the tool showed a positive expected return premium for this portfolio. The sole exception was the Below 2°C (B2C) scenario, which indicated a negative outlook. At that time, the Divergent Net Zero (DNZ) scenario offered the greatest upside, with an annualized excess return of about +1.07% – the highest among the scenarios analyzed.
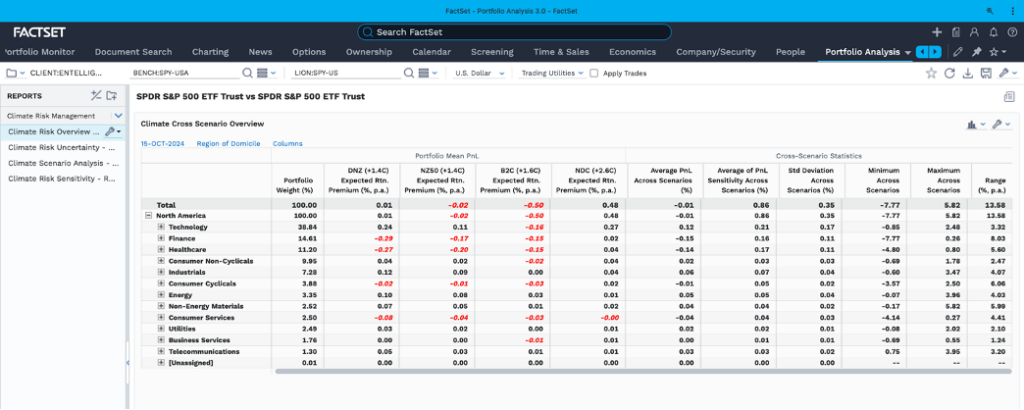
Fast forward six months to October 15, 2024, and the analysis had shifted dramatically. By that point, the NDC scenario was the only one still showing a positive return premium; all of the more aggressive transition scenarios had turned strongly negative. With a new administration looking almost certain, this confirmed that the market was pivoting toward a less policy-driven transition assumption. Investors who monitored these signals could reallocate their portfolios toward the NDC scenario, reducing exposure to strategies reliant on more ambitious globalist agenda.
Finally, by January 15, 2025, on the eve of the new U.S. administration, virtually all economic scenarios except NDC showed sharply negative return prospects – a clear warning sign to de-risk portfolios from the more aggressive transition bets.
Over the past two years, markets appear to have been pricing in an NDC economic scenario (a less ambitious, less globally coordinated transition) rather than a NZ50 trajectory.

Over the last two years, this multi-scenario analysis has helped investors decipher how the market’s transition expectations have evolved and adjust their strategies accordingly. By leveraging these insights, performance analysts were able to see when the market’s favored transition pathway changed, and risk managers could reposition portfolios to avoid the most vulnerable transition scenarios while benefiting from those more likely to play out.
* Source: RealClearPolling 2024 U.S. presidential election betting odds: https://www.realclearpolling.com/betting-odds/2024/president
** The SPY ETF is used as a proxy for the S&P 500 index in this analysis.
*** “Transition Leaders” refers to the top quintile (top 20%) in each industry (RBICS Level 1 sector) of the SPY ETF according to a 10-year risk metric for each NGFS scenario as modeled by Entelligent.
Source: FactSet Portfolio Analysis, Entelligent T-Risk Multi-Scenario 10yr. Chart 1: data from April 1st, 2023, to April 1st, 2024. Chart 2: data from April 1st, 2024, to April 1st, 2025. Data available on the FactSet platform and Open: FactSet Marketplace. NGFS Scenarios: https://www.ngfs.net/ngfs-scenarios-portal/