Global financial data provider FactSet published an important new article about climate scenario analysis and stress testing, written by Kristina Bratanova, CFA, the company’s Senior Product Manager for ESG, Climate, Regulatory Risk. The author chose Entelligent’s T-Risk data solution as the basis for a set of hypothetical stress tests on FactSet’s Portfolio Analytics platform.
The article is worth a close look for two reasons:
1 – It validates the impact of Entelligent’s T-Risk — an energy-based measure of transition and non-localized physical risk that provides insight not just into the transition’s downside impacts but also its upside opportunities.
2 – For portfolio managers and analysts who rely on FactSet, it’s a useful step-by-step guide to meeting a risk management requirement that’s proven challenging to those who rely on traditional climate data and tools.
Sample exhibits follow below and you can read the full article here.
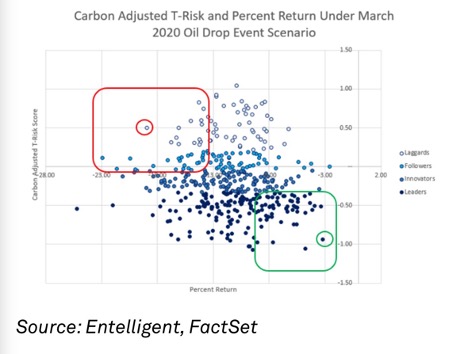
The plot below (the study’s first exhibit) highlights overweighting a stock with a return of -3% and a T-Risk Carbon-Adjusted score of -0.9 (green circle) over one with a -19% loss and a Carbon-Adjusted T-Risk score of 0.5 (red circle). This would, if the oil price drop scenario repeats today, increase the T-Risk score at the portfolio level and reduce the expected loss.
Insight/2023/11.2023/11.20.2023_Key%20Considerations%20for%20Stress%20Testing%20with%20Climate%20Risk%20Data/008-carbon-adjusted-t-risk-2020-oil-drop.png?width=642&height=434&name=008-carbon-adjusted-t-risk-2020-oil-drop.png)
Source: Entelligent, FactSet
The same analysis could be performed within a given industry or sector with two examples below, where we focus on the Materials and Consumer Discretionary sectors. Red areas depict companies with high transition risks and worse return under the selected scenario. Green areas outline companies with lower transition risks and lower losses under the event stress test.
Insight/2023/11.2023/11.20.2023_Key%20Considerations%20for%20Stress%20Testing%20with%20Climate%20Risk%20Data/009-materials-and-consumer-discretionary-companies.png?width=1151&height=400&name=009-materials-and-consumer-discretionary-companies.png)
Source: Entelligent, FactSet
You can read the full article here.
To learn more about Entelligent on FactSet, visit us at the Open FactSet Marketplace.